One of the common questions posed by Maximo administrators is, ‘How do I modify the QBR template?’ The question makes perfect sense because once a QBR report is created in Maximo, it can be scheduled to run like a standard BIRT report or exported as a standard .rptdesign file. So somewhere inside Maximo is a template that is used by QBR to create reports and should be editable by an administrator. Right? Kind of. While the actual report template isn’t available to administrators, modifying the MaximoSystemLibrary.rptlibrary and understanding the concept of element inheritance will get most of the customizations administrators have asked for.
First off, to do any of the updates I am going to describe below will require a properly installed BIRT Report Designer environment for Maximo (see Maximo Report Wiki for details). Second, test and verify any of the changes described below in a TEST environment first. Only the brave (and foolish) publish to PROD without testing. Third, the changes listed below will also affect any out of the box IBM reports as well – this will be made clearer in a couple paragraphs.
Element Inheritance
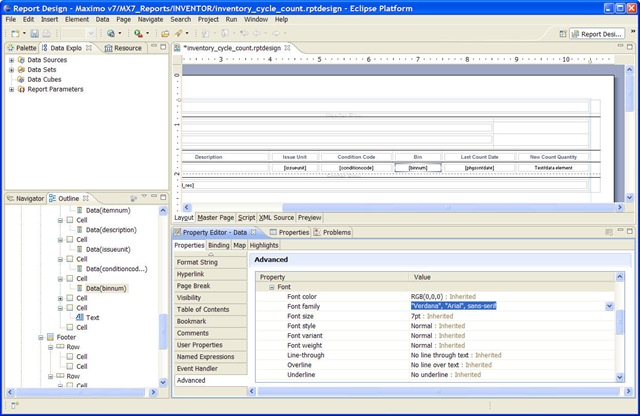
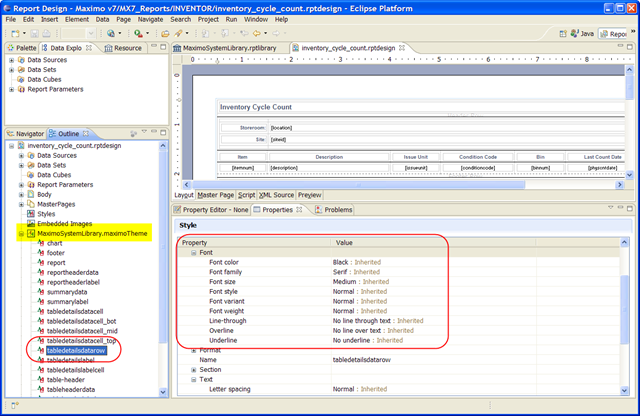
Part of the ‘magic’ of how the MaximoSystemLibrary.rptlibrary file affects QBR reports is a cascading formatting function for report elements called inheritance. Reports created in the BIRT Report Designer, out of the box BIRT reports from IBM, and reports created via a QBR all have a element inheritance by default. So when a new element is added (text, label, dynamic text, data, etc) it will be setup to look and use the formatting values of its parent element. For example, the ‘BINNUM’ element shown below is inheriting all of its formatting from its parent element.
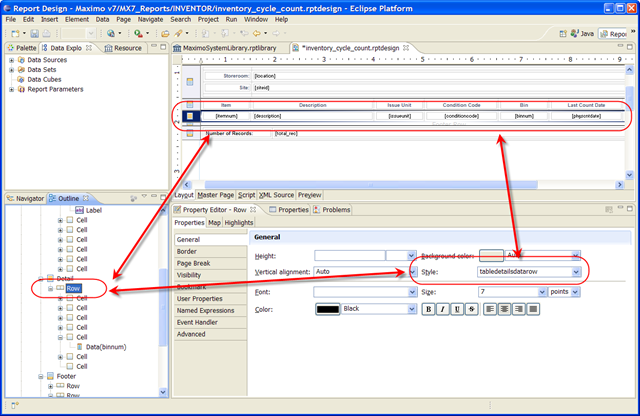
But when we look at the row that element sits in, it too uses inheritance, but this time its inheritance is based on a style theme. The theme is called ‘tabledetailsdatarow’.
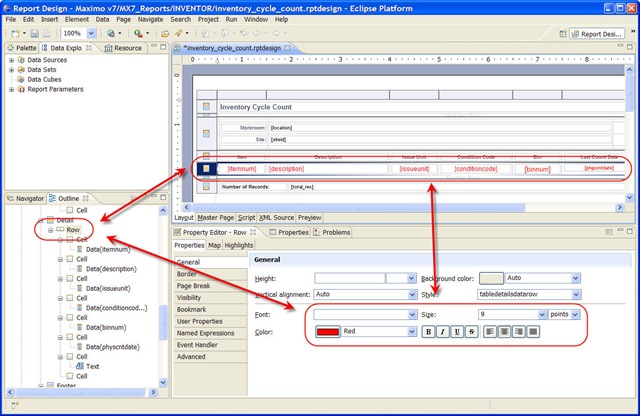
The theme can be overridden, and because of inheritance, the changes will cascade down to the elements in the row. An example change will be to make the font color Red, center alignment, and font size 9pt. When that is done, all the child elements in the row will update as well.
If you look closely you’ll notice the ‘description’ element didn’t change its alignment. Why? Because the data element for the ‘description’ field had its alignment set to Left at the element level. Since the alignment was set at the cell element level, and the inherited flag was no longer used, the ‘description’ element didn’t use alignment change that was applied to the row element.
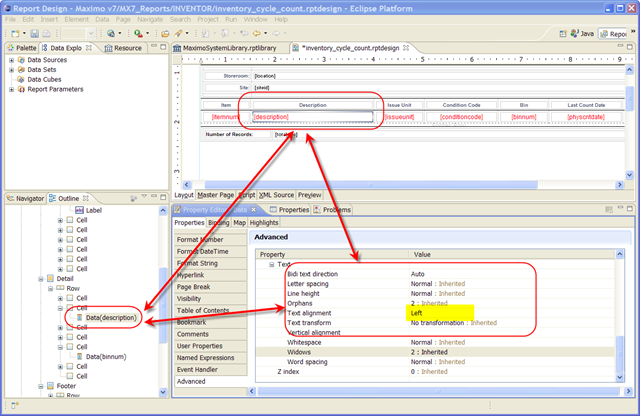
So even though the row was set to be center aligned, because the cell element ‘description’ was set to left aligned, the element is left aligned.
Modify Maximo Themes
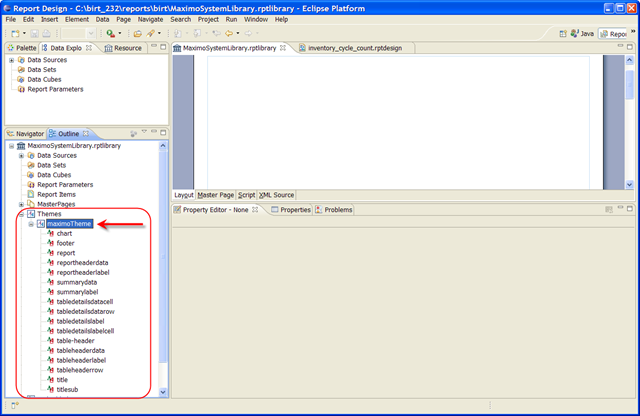
So what does this have to do with QBR reports? Remember one of the details shown with the data row was there was a theme that was part of the inheritance. Poking around an rptdesign file, on the left side in the BIRT editor in the report Outline, there is a reference to the MaximoSystemLibrary file and it lists the default themes in the file.
While the theme values can’t be updated in the rptdesign file, the library file can. The MaximoSystemLibrary.rptlibrary should be located inside the BIRT Report Designer folders at:
x:\<birt install folder>\reports\birt\libraries
Open the MaximoSystemLibrary.rptlibrary file in the BIRT Report Designer. Once the rptlibrary is open, click the Themes, maximoThemes to see all of default themes.
The examples that will be used are on the ‘tabledetailsdatarow’ theme element. To make adjustments, click on the theme element and then onto the Properties tab.
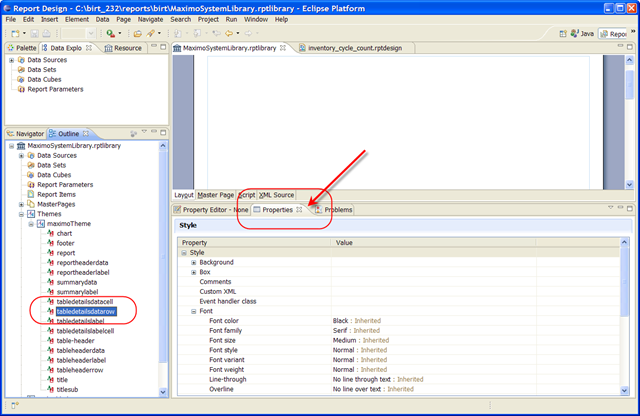
From there, the theme details can be modified. The planned changes for this element is to make data row elements to be center aligned, sans serif font, and white text on black background. Once the edits are made, save the MaximoSystemLibrary.rptlibrary file and update Maximo per steps in the Modifying Logos KB doc file.
The Results
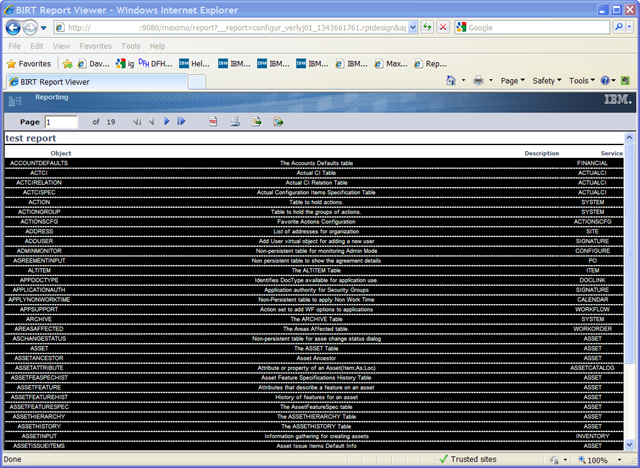
Once the new rptlibrary file is loaded, run a QBR report. The report created below is a list of tables from the Database Configuration application. If everything was done correctly, the QBR report should look like this:
So now an administrator can apply most of the formatting, or design guidelines, used on custom BIRT reports to QBR reports. The other option administrators have is the ability to add new themes that can be used in the BIRT Designer. The caveat, as previously mentioned, is that any changes made to any out of the box style themes in the MaximoSystemLibrary.rptlibrary file will also affect IBM’s out of the box reports. For example, here is what the out of the box ‘Failure Code Hierarchy’ report now looks like.

Got any qustions? Feel free to drop me a tweet at @MyGeekDaddy.


2 thoughts on “Modifying the look of Maximo QBR Reports”